← 返回列表
🔗 原文
A Light-Up Map Of Monaco

If you want to get around Monaco, a map — digital or otherwise — is probably the best way to navigate. But if you just want to appreciate the city’s form in a more artistic way, you might enjoy [Terence Grover’s] latest project—a backlit topographic map of the unique principality.
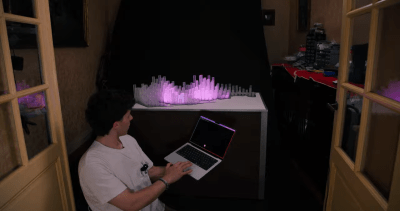
The touch mode allows one to draw patterns across the map.

The project started with a QGIS mesh of Monaco, with the data fed through the Open-Meteo elevation API, which takes into account building heights. This was used as the basis for the heights of 179 pieces of 20 mm x 20 mm acrylic. These were assembled into a laser cut steel base, and were sanded on all sides but the base in order to allow them to diffuse light more effectively.

Strips of CS8812 LEDs are used to light the plastic towers, driven by a pair of Adafruit Feather RP2040 Scorpio boards. They’re fed pixel data from a Raspberry Pi 5, which runs a Flask panel accessed over an iPad. This allows control over the LED map display, showing things like civic data, highlighted events, and weather. There’s even a touch-sensitive mode that lets one paint fun patterns across the representation of the city.

We love a good artistic map, particularly when they’re full of LEDs and represent useful information.

🤖 AI 总结
这篇文章介绍了一种摩纳哥发光地图,它既可用于导航,也能帮助人们欣赏城市美景。

If you want to get around Monaco, a map — digital or otherwise — is probably the best way to navigate. But if you just want to appreciate the city’s form in a more artistic way, you might enjoy [Terence Grover’s] latest project—a backlit topographic map of the unique principality.

The touch mode allows one to draw patterns across the map.

The project started with a QGIS mesh of Monaco, with the data fed through the Open-Meteo elevation API, which takes into account building heights. This was used as the basis for the heights of 179 pieces of 20 mm x 20 mm acrylic. These were assembled into a laser cut steel base, and were sanded on all sides but the base in order to allow them to diffuse light more effectively.

Strips of CS8812 LEDs are used to light the plastic towers, driven by a pair of Adafruit Feather RP2040 Scorpio boards. They’re fed pixel data from a Raspberry Pi 5, which runs a Flask panel accessed over an iPad. This allows control over the LED map display, showing things like civic data, highlighted events, and weather. There’s even a touch-sensitive mode that lets one paint fun patterns across the representation of the city.

We love a good artistic map, particularly when they’re full of LEDs and represent useful information.

原文
A Light-Up Map Of Monaco

If you want to get around Monaco, a map — digital or otherwise — is probably the best way to navigate. But if you just want to appreciate the city’s form in a more artistic way, you might enjoy [Terence Grover’s] latest project—a backlit topographic map of the unique principality.

The touch mode allows one to draw patterns across the map.

The project started with a QGIS mesh of Monaco, with the data fed through the Open-Meteo elevation API, which takes into account building heights. This was used as the basis for the heights of 179 pieces of 20 mm x 20 mm acrylic. These were assembled into a laser cut steel base, and were sanded on all sides but the base in order to allow them to diffuse light more effectively.

Strips of CS8812 LEDs are used to light the plastic towers, driven by a pair of Adafruit Feather RP2040 Scorpio boards. They’re fed pixel data from a Raspberry Pi 5, which runs a Flask panel accessed over an iPad. This allows control over the LED map display, showing things like civic data, highlighted events, and weather. There’s even a touch-sensitive mode that lets one paint fun patterns across the representation of the city.

We love a good artistic map, particularly when they’re full of LEDs and represent useful information.

中文翻译
A Light-Up Map Of Monaco

翻译尚未生成